Agents That Look Before They Answer
Published:
TL;DR: this round stayed inside the fresh May 3-4 window and picked three papers about giving models a better inspection step before they answer or generate. FlexSQL lets a data agent revisit schemas, values, execution results, and plans instead of freezing retrieval up front. Chart-FR1 trains chart reasoning around explicit visual focus, so dense charts are not treated as one undifferentiated image. PV-VAE changes video VAE training from pure reconstruction to predictive reconstruction, pushing latents to carry motion-relevant structure rather than only pixel detail.
What I Am Watching This Round
The recent Paper Radar issues have been heavy on external evidence surfaces: workflow traces, document graphs, reward-model activations, replayable workspaces. I still care about that line, but this issue moves one step earlier. Before a model can leave useful evidence, it has to know what to inspect.
For a data agent, that means inspecting the database while reasoning, not hoping a one-shot schema linker found the right tables. For a chart model, it means pointing the reasoning chain at local marks, OCR text, and boxes rather than asking a vision encoder to absorb every subplot equally. For a video world model, it means forcing the latent state to predict what comes next, not merely reconstruct what was already visible.
I screened strict 24-hour arXiv leads including MolmoAct2, orchestration-trace RL for multi-agent systems, FlexSQL, latent reasoning in MLLMs, AcademiClaw, ARA, AutoFocus, long-horizon training, DataClaw, and PhysicianBench. I kept three papers because their open HTML had enough methods, equations, figures, and source-locatable numbers for real mini explainers. I also kept the recent writing feedback in mind: each paper gets a field on-ramp, dense tables are rewritten as Markdown, and mechanism details are shown with equations when they carry the idea.
Paper Notes
FlexSQL: Flexible Exploration and Execution Make Better Text-to-SQL Agents
Authors: Quang Hieu Pham, Yang He, Ping Nie, Canwen Xu, Davood Rafiei, Yuepeng Wang, Xi Ye, Jocelyn Qiaochu Chen.
Institutions: University of Alberta; Simon Fraser University; University of Waterloo; Snowflake; Princeton University; New York University.
Date/Venue: May 4, 2026, arXiv preprint.
Links: arXiv | HTML | code
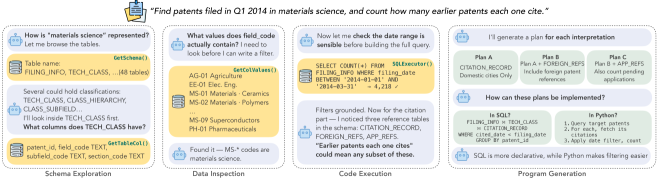
The motivating trace shows the core behavior I want from a data agent: it does not treat the database as a static prompt attachment. It discovers schema, checks values, runs partial verification, and keeps multiple interpretations alive long enough to test them. The caveat is that the trace is a condensed example, so it illustrates the mechanism rather than proving robustness by itself.
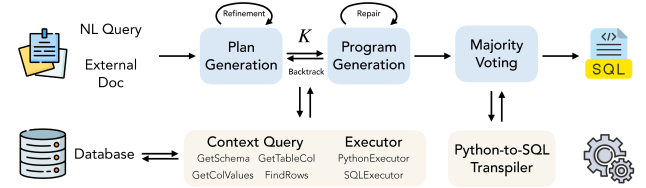
The framework diagram is the most useful systems view. FlexSQL has plan generation, program generation, repair, plan backtracking, and majority voting across SQL and Python outputs. The important detail is that backtracking can move from a code error to a plan error: a wrong table or query interpretation is not forced through a local SQL patch.
Quick idea: FlexSQL turns text-to-SQL into an interactive data-agent problem, where schema exploration, value inspection, execution, repair, and plan revision can happen throughout reasoning.
Why it matters: enterprise databases are not the neat single-schema worlds used in older semantic parsing benchmarks. The paper notes that Spider2.0 includes Snowflake databases where almost 10% of 152 databases exceed 100 tables, and the largest contain 60,000 to 72,000 columns. A fixed pipeline that retrieves schema once at the start is brittle in that setting: early schema errors become hidden assumptions, and execution feedback arrives too late to repair the plan that caused the error.
Method walkthrough:
- FlexSQL preprocesses large databases by pruning all-null columns and grouping time-suffixed tables with identical schemas, then routes from database to schema to table using tools such as
GetSchema,GetTableCol,GetColValues, andFindRows. - It generates (K) diverse natural-language execution plans, prompting each batch to differ from earlier plans. During planning, the agent can inspect schema, examine values, and run test queries, so plans are grounded in live database evidence.
- Each plan is implemented in either SQL or Python. Python is allowed when a procedural workflow, regular expression, or analytical library is easier than a single SQL statement.
- Repair distinguishes code-level errors from plan-level errors. Code errors trigger local regeneration; plan errors trigger backtracking to plan generation and more database exploration.
- Majority voting groups outputs by execution result regardless of language. If the winning output came from Python, FlexSQL transpiles it back to SQL and verifies output equivalence.
Main Spider2.0 result slice from the paper.
| Model | Metric | Spider2-Snow DSR-SQL | Spider2-Snow ReFoRCE | Spider2-Snow FlexSQL | Spider2-SQLite DSR-SQL | Spider2-SQLite ReFoRCE | Spider2-SQLite FlexSQL |
|---|---|---|---|---|---|---|---|
| gpt-oss-120b | Pass@1 | 33.27 | 44.12 | 55.15 | 48.15 | 45.19 | 57.78 |
| gpt-oss-120b | Majority@8 | 50.37 | 48.90 | 59.74 | 51.85 | 54.07 | 64.44 |
| gpt-oss-120b | Pass@8 | 63.24 | 62.32 | 78.68 | 57.78 | 71.11 | 78.52 |
| gpt-oss-20b | Pass@1 | 32.54 | 36.76 | 43.20 | 34.81 | 42.96 | 50.37 |
| gpt-oss-20b | Majority@8 | 42.65 | 43.01 | 50.92 | 37.04 | 46.67 | 54.07 |
The cleanest result is not just the top row. The smaller gpt-oss-20b FlexSQL system reaches 50.37 Pass@1 on Spider2-SQLite, beating both listed 120B baselines on that split. The paper also reports table-level schema linking F1 of 95.26 for FlexSQL best-of-8 on Spider2-Snow, compared with 82.65 for DSR-SQL + DeepSeek-V3 and 80.03 for ReFoRCE with mixed proprietary models. That supports the claim that flexible exploration is improving grounding, not only generating more samples.
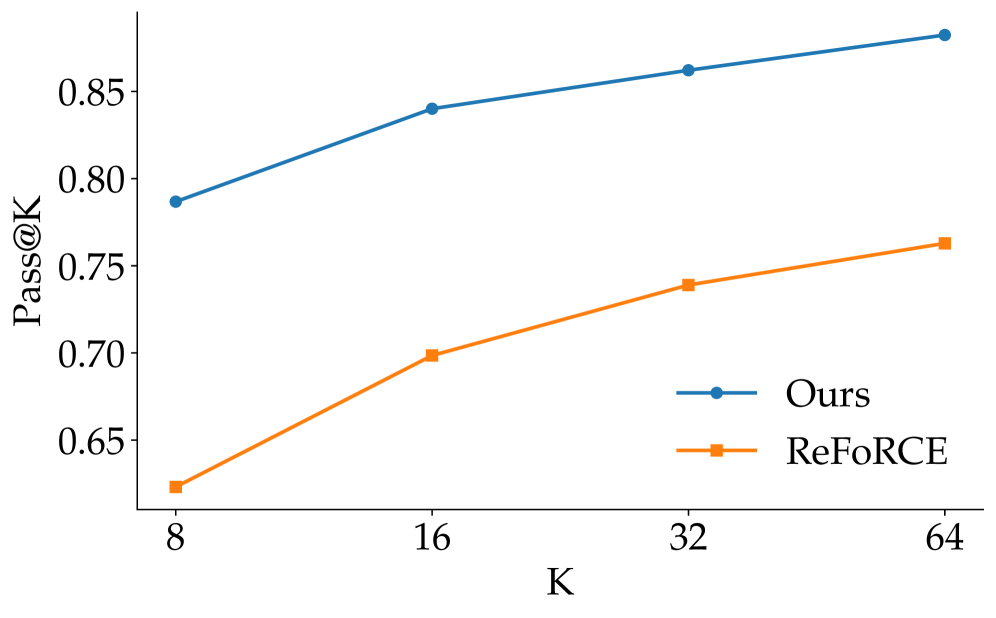
This plot matters because it asks whether the method benefits from more test-time attempts. FlexSQL keeps a lead over ReFoRCE as (K) increases, which is what I would expect if plan diversity and execution feedback are doing real work. The caveat is cost: scaling (K) buys accuracy, but deployment systems still need a latency and budget policy.
Ablation slice from the paper.
| Setup on Spider2-SQLite | Majority@8 | Pass@8 | Micro Acc. |
|---|---|---|---|
| gpt-oss-120b FlexSQL | 64.44 | 78.52 | 49.69 |
| without Python | 52.59 | 68.89 | 41.10 |
| without diverse planning | 55.56 | 83.70 | 50.23 |
| without plan backtracking | 61.48 | 80.00 | 48.64 |
| without all repair | 57.04 | 79.26 | 46.79 |
The ablation is useful because it separates three things that often get blurred: tool access, diverse plans, and bilingual execution. Removing Python hurts majority accuracy sharply, which suggests that Python is not a cosmetic intermediate representation; it solves some analytical questions before they are transpiled back to SQL. Removing diverse planning lowers majority accuracy but can raise Pass@8, a reminder that more varied samples may include more one-off correct answers while making consensus harder.
My judgment: I would read FlexSQL as an argument for database agents as interactive investigators rather than SQL string generators. The strongest part is the recovery loop from plan errors, because many data-agent failures come from the wrong assumption upstream of the code. The weaker point is still operational policy: when should an agent stop exploring, how much test-time sampling is worth paying for, and how should uncertainty be exposed to the user when several execution outputs look plausible?
Connection to tracked themes: data agents, text-to-SQL, tool-grounded reasoning, auditability through execution.
Chart-FR1: Visual Focus-Driven Fine-Grained Reasoning on Dense Charts
Authors: Hongkun Pan, Yuwei Wu, Wanyi Hong, Shenghui Hu, Qitong Yan, Yi Yang, Rufei Han, Changju Zhou, Minfeng Zhu, Dongming Han, Wei Chen.
Institutions: Zhejiang University; State Key Lab of CAD&CG, Zhejiang University; HiThink Research.
Date/Venue: May 3, 2026, arXiv preprint.
Links: arXiv | HTML | code
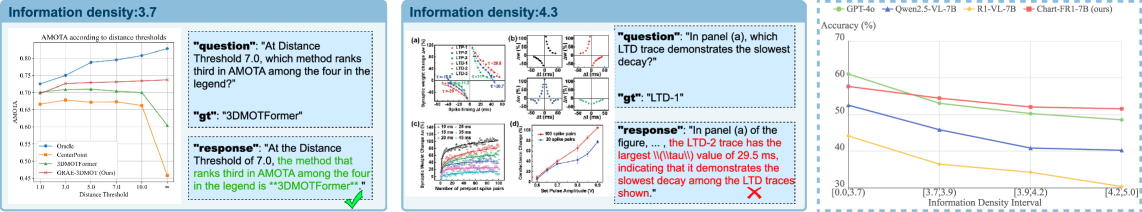
The example shows why dense chart reasoning is not the same as ordinary VQA. As information density rises, a model has to select which legend item, subplot, label, local region, or OCR text is relevant before it can reason numerically. The caveat is that the figure compares selected examples and a trend line, so it should be read together with the benchmark results rather than as standalone proof.
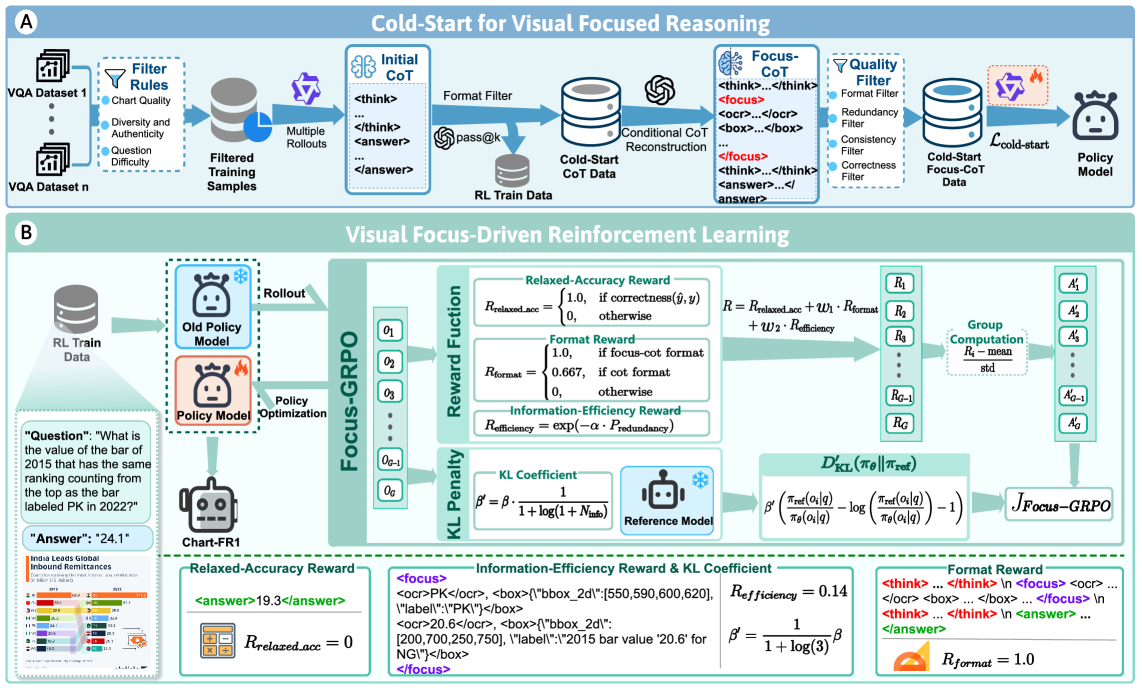
This overview is the paper’s method in one picture. Stage 1 creates Focus-CoT cold-start data, where reasoning steps are explicitly linked to OCR text and local regions. Stage 2 uses Focus-GRPO, whose rewards push answers to be correct, formatted as focus-aware reasoning, and economical in the amount of visual evidence they pull in.
Quick idea: Chart-FR1 trains multimodal chart reasoning to focus before it reasons: the model learns to attach reasoning steps to local visual evidence, then uses an RL objective that rewards accurate and efficient focus.
Why it matters: chart QA looks easy until the chart becomes crowded. In scientific figures, business dashboards, and financial reports, the answer is often buried behind a legend, a secondary axis, small OCR text, or a comparison across subplots. General MLLMs may see the whole chart but still miss the right mark. The product problem is familiar in document intelligence: a correct answer needs an evidence path, not just a decoded sentence.
Method walkthrough:
- Focus-CoT adds a
<focus>action to reasoning. A focus step can extract OCR text or localize an image region, so the following reasoning is conditioned on specific visual cues. - The authors generate cold-start data by sampling chart questions, producing candidate reasoning paths, filtering by format and correctness, and using a teacher model to insert focus tags or revise incorrect chains. A final quality filter removes wrong or redundant focus traces.
- Focus-GRPO then samples multiple outputs from the old policy and scores them with relaxed accuracy, format reward, and information-efficiency reward.
- The information-efficiency reward penalizes redundant OCR text, overlapping boxes, and OCR-box duplication:
- The KL penalty is adaptive. When the model focuses on more visual cues, the KL constraint is relaxed:
This is a small but important design choice. Standard GRPO can be too rigid for dense charts because a hard example may need longer visual search. The adaptive penalty gives the model more room when there is more evidence to inspect, while keeping simpler cases closer to the reference policy.
The benchmark construction is also part of the contribution. The paper defines Chart-ID from information richness, efficiency, clarity, and interactivity:
\[\text{Chart-ID}=\frac{S_{\text{rich}}}{2}+\frac{S_{\text{eff}}}{5}+\frac{S_{\text{clar}}}{5}+\frac{S_{\text{inter}}}{10}.\]HID-Chart contains 734 charts and 1,561 QA pairs, with average information density 3.94, 10 chart types, and 8 domains. The human-in-the-loop pipeline starts from about 2,500 charts, filters for high information density, uses GPT-5 to generate candidate questions, and has five graduate students remove ambiguous questions, rewrite simple ones, and annotate answers.
HID-Chart dataset slice from the paper.
| Statistic | Value |
|---|---|
| Total charts | 734 |
| Average information density | 3.94 |
| Domains / chart types | 8 / 10 |
| Average image size | 1090 x 796 px |
| Unique questions | 1,561 |
| Average question length | 20.9 tokens |
| Unique answer tokens | 1,795 |
Training and cue ablation slice from the paper.
| Model | ChartQA | CharXiv | EvoChart | ChartBench | PlotQA | Avg |
|---|---|---|---|---|---|---|
| Qwen2.5-VL-7B | 87.3 | 42.5 | 53.5 | 66.4 | 55.5 | 61.0 |
| Chart-FR1-7B | 91.0 | 46.6 | 59.2 | 75.6 | 62.9 | 67.1 |
| without Focus-GRPO | 87.6 | 40.8 | 54.8 | 71.6 | 58.5 | 62.7 |
| without Cold-Start | 90.0 | 42.0 | 57.7 | 72.3 | 61.5 | 64.7 |
| without OCR | 89.6 | 42.5 | 59.0 | 71.5 | 60.1 | 64.5 |
| without boxes | 89.9 | 43.2 | 59.7 | 72.4 | 60.6 | 65.2 |
The gains are broad rather than only on the authors’ new benchmark. Chart-FR1-7B improves the five-benchmark average from 61.0 to 67.1 over Qwen2.5-VL-7B. The cue ablation is especially helpful: removing OCR causes a 2.6-point drop from the full model average, and removing boxes causes a 1.9-point drop. That supports the paper’s claim that both textual and regional visual cues are doing work.
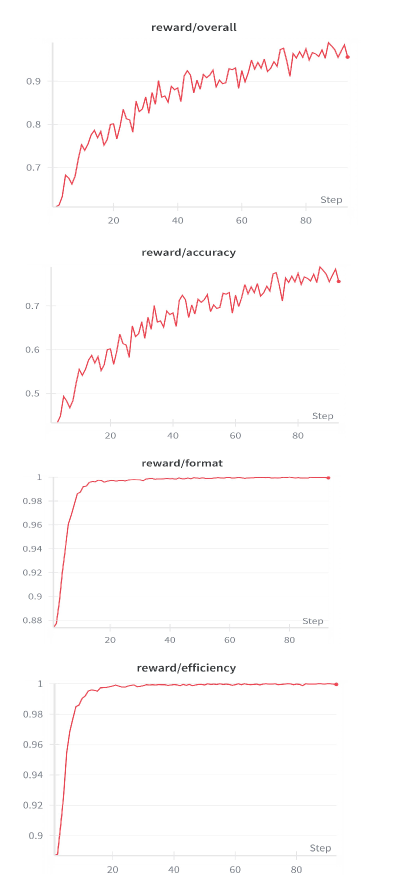
The reward curves are useful because the method could otherwise sound like a prompt format trick. They show Focus-GRPO training moving reward components during optimization rather than only relying on cold-start formatting. The caveat is that reward curves do not by themselves guarantee faithful evidence use; they need the ablations and dense-chart evaluation to rule out format-only learning.
My judgment: I like this paper because it makes chart reasoning less mystical. It says: find the relevant marks, keep the focus economical, then reason. I would be cautious about teacher dependence and judge dependence, since GPT-5 appears in data generation, Chart-ID scoring, and some evaluation prompts. But the mechanism is directionally right for document agents: answers over visual documents should carry explicit evidence acquisition steps, not only final prose.
Connection to tracked themes: document intelligence, chart reasoning, multimodal RL, visual evidence grounding.
Video Generation with Predictive Latents
Authors: Yian Zhao, Feng Wang, Qiushan Guo, Chang Liu, Xiangyang Ji, Jian Zhang, Jie Chen.
Institutions: not specified in the accessible arXiv HTML.
Date/Venue: May 4, 2026, arXiv preprint.
Links: arXiv | HTML
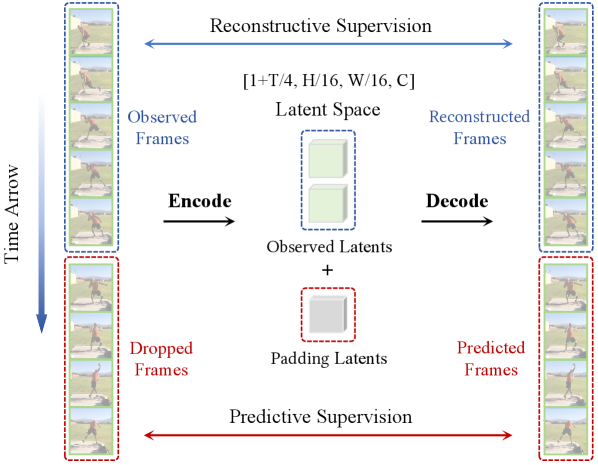
The framework diagram makes the training change clear. PV-VAE randomly drops future frame groups, encodes only the observed prefix, pads the missing latent slots, and asks the decoder to reconstruct the whole clip. The caveat is that this is still a VAE training objective, not a full planning agent; the world-model relevance comes from what the latent state is forced to preserve.
Quick idea: PV-VAE trains video latents with a predictive reconstruction task, so the latent space must encode temporally useful structure rather than only reconstructing visible pixels.
Why it matters: video VAEs are often judged by reconstruction, but video generators use their latents as the substrate for diffusion. A latent that reconstructs sharp frames may still be poor for generation if it does not organize motion, temporal coherence, and future dynamics. This is the world-model lesson in miniature: state is only useful if it preserves the information the downstream process needs.
Method walkthrough:
- A video clip is split into observed frames and dropped future frames, (\mathbf{x}=\langle\mathbf{x}{obs},\mathbf{x}{drop}\rangle). The encoder sees only (\mathbf{x}_{obs}).
- The number of dropped temporal groups is sampled from a uniform range controlled by the maximum dropping ratio. The observed latent sequence is padded with uninformative or learnable vectors so the decoder receives a full-length latent sequence.
- The decoder reconstructs the full clip, including frames withheld from the encoder. This forces the latent space to carry predictive information about video evolution.
- The architecture uses 3D causal convolutions with 4x temporal and 16x spatial downsampling and 64 latent channels.
- Training includes image pretraining, video training with predictive reconstruction, and a decoder fine-tuning stage that freezes the encoder and turns off random dropping to close the training-inference gap.
The total loss combines reconstruction, temporal difference reconstruction, perceptual loss, adversarial loss, and KL regularization:
\[\mathcal{L}_{total}=\lambda_{rec}(\mathcal{L}_{\text{MSE}}+\mathcal{L}_{\text{Diff}})+\lambda_{lpips}\mathcal{L}_{\text{LPIPS}}+\lambda_{gan}\mathcal{L}_{\text{GAN}}+\lambda_{kl}\mathcal{L}_{\text{KL}}.\]The (\mathcal{L}_{\text{Diff}}) term is worth calling out. Static backgrounds can dominate ordinary reconstruction because they occupy many pixels. Reconstructing temporal differences pushes the VAE to allocate capacity to motion and temporal change.
Generation comparison slice from the paper.
| Method | Latent config | UCF101 FVD | UCF101 KVD | UCF101 IS | RealEstate10K FVD | RealEstate10K KVD | Training speed | Training memory |
|---|---|---|---|---|---|---|---|---|
| Hunyuan-VAE | t4s8c16 | 210.30 | 52.81 | 66.40 | 83.45 | 13.23 | 1.64 it/s | 87.36 GiB |
| Wan2.1 VAE | t4s8c16 | 167.10 | 11.54 | 66.04 | 83.84 | 10.64 | 1.88 it/s | 86.44 GiB |
| Wan2.2 VAE | t4s16c48 | 180.79 | 17.80 | 67.32 | 87.15 | 10.11 | 4.96 it/s | 30.90 GiB |
| SSVAE | t4s16c48 | 168.68 | 19.71 | 66.39 | 79.08 | 8.79 | 3.92 it/s | 34.00 GiB |
| PV-VAE | t4s16c64 | 146.37 | 14.52 | 69.72 | 72.50 | 4.06 | 4.40 it/s | 33.34 GiB |
PV-VAE improves UCF101 FVD by 34.42 relative to Wan2.2 VAE and by 22.31 relative to SSVAE, while keeping training memory near the other high-compression VAEs. The authors also report 52% faster convergence and a 34.42 FVD gain over Wan2.2 VAE on UCF101. It is not a free win: on Kinetics-400 reconstruction, PV-VAE is comparable to high-compression baselines but not always better than Wan2.2 on reconstruction metrics.
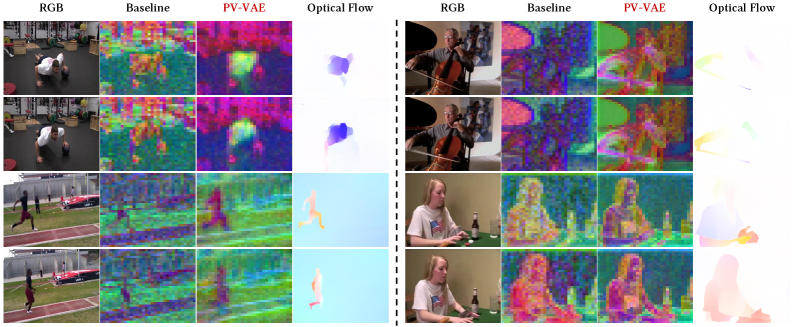
This PCA visualization is the figure that turns the paper from a metric story into a representation story. PV-VAE’s latent activations align more clearly with motion regions and optical flow, while static background areas look less noisy. That supports the claim that predictive reconstruction changes what the latent space cares about, though PCA is still a diagnostic image rather than a causal proof.
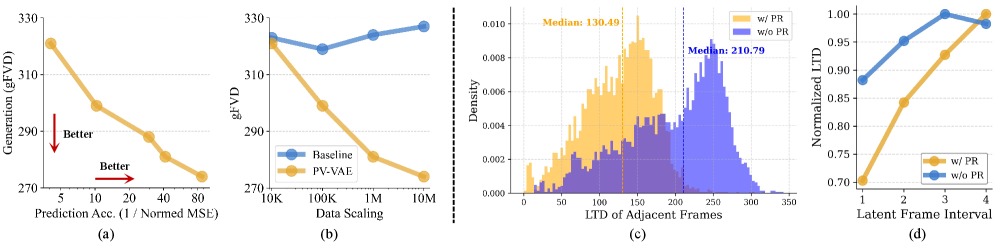
The analysis figure links prediction accuracy, scaling, and temporal coherence. The paper reports that predictive accuracy correlates with generative quality, that PV-VAE benefits more cleanly from data scaling than pure reconstruction, and that latent temporal distance changes more smoothly with frame interval. The caveat is that these analyses are internal to the same training setup; I would want to see whether the same latent advantages survive when plugged into different diffusion backbones.
Ablation and probing evidence from the paper.
| Configuration | UCF101 gFVD | Kinetics rFVD | PSNR | SSIM | LPIPS |
|---|---|---|---|---|---|
| Baseline | 174.81 | 3.03 | 33.44 | 0.96 | 0.017 |
| + Predictive Reconstruction | 156.33 | 5.66 | 31.47 | 0.94 | 0.026 |
| + Motion-aware Objective | 150.10 | 5.79 | 31.38 | 0.94 | 0.026 |
| + Decoder Fine-tuning | 146.37 | 3.45 | 32.26 | 0.95 | 0.020 |
| Latent probing task | Without predictive reconstruction | With predictive reconstruction |
|---|---|---|
| Optical flow EPE, lower is better | 5.9223 | 5.1805 |
| Next-frame MSE, lower is better | 0.0314 | 0.0289 |
| Point tracking AUC, higher is better | 70.95 | 76.99 |
The ablation tells a nice story: predictive reconstruction improves generation but hurts reconstruction until the decoder is fine-tuned; the motion-aware term improves generation further; decoder fine-tuning recovers much of the reconstruction quality. The probing tasks are useful because they ask whether the latent features help motion understanding beyond the generator’s final video score.
My judgment: PV-VAE is a good reminder that world-model-ish training can live inside a representation component, not only in an explicit planner. The paper’s strongest claim is not that it is a complete world model, but that video latents become more useful when asked to predict withheld future frames. I would watch whether this objective scales to longer videos, text-conditioned generation, and robot interaction videos where the future depends on actions rather than passive motion.
Connection to tracked themes: world models, predictive latents, video generation, representation design.
Reading Priority and Next Questions
I would read FlexSQL first if the goal is data-agent product design: it gives concrete tools, loops, and failure modes. I would read Chart-FR1 first for document intelligence and chart QA, because it gives a clean recipe for linking reasoning to visual evidence. PV-VAE is the one I would keep on the world-model shelf: it is not an agent paper, but it sharpens the question of what a useful latent state should preserve.
Next questions I want to track: can data agents learn when to stop exploring instead of only scaling test-time samples, can chart/document models expose focus traces that survive audit rather than only training-time tags, and can predictive latent objectives incorporate actions so they become useful for planning rather than only generation?